2016 Electoral College Map Projections for the Presidential Elections: Democrats Up, Republicans the Underdog; Plus the Swing States

Although still months away from the 2016 Presidential Elections in November, map projections and predictions for what the electoral college map could potentially look like – state by state and whether they will lean left or right toward Donald Trump or Hillary Clinton – are already surfacing online.
270ToWin Projections
Here is one example on what the electoral vote map could look like. The state-by-state projections provided by website 270ToWin show which states lean Democrat and which others lean Republican in a map entitled "Consensus Pundit Electoral Map." It also include the potential swing states. This map aggregates and averages data as of May 27, 2016, from the following reports: Sabato's Crystal Ball, Cook Political Report, Rothenberg-Gonzales Political Report, NBC Political Unit and The Fix (Washington Post).
Note: Only states rated safe by all 5 pundits are shown in the darkest shade. Mississippi, Montana, New Jersey, New Mexico, Oregon were rated safe by 4 of 5.
Freedom's LightHouse Projections
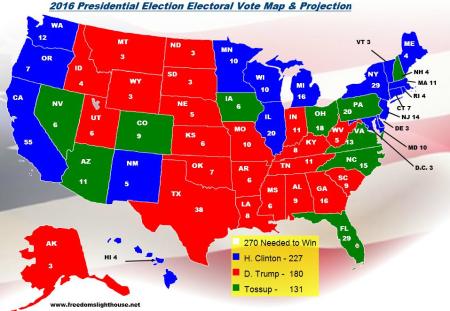
Here is another example on what the electoral vote map could look like. The state-by-state projections provided by website FreedomsLighthouse.net shows which states would be won by Hillary Clinton and which states by Donald Trump in the case that both were declared the official nominees for the political parties. According to the website, the following visual is based on polls but in addition it takes into account the voting pattern of that state in previous presidential elections as well as the quantity of polls available.

RealClear Politics Projections
Here is another example on what the electoral college map could look like should the confirmed presidential nominees be Hillary Clinton and Donald Trump. The state-by-state projections provided by website RealClearPolitics show:
Clinton - 204 electoral votes (CA, WA, NM, MN, WI, IL, NY, VT, ME, MA, RI, CT, NJ, DE, MD, DC, HI)
Trump - 164 electoral votes (TX, UT, ID, MT, WY, ND, SD, NE, KS, OK, LA, AR, MD, AL, TN, KN, IN, WV, SC, AK
Tossup - 170 electoral votes (OR, NV, AZ, CO, IA, MI, OH, PA, NH, VA, NC, GA, FL)
Click here for the full visual.


 Click the map to create your own at


